Many Trading Indicator (MTI)
Smarter trading signals for modern traders — MTI helps you see market direction clearly and trade with the trend systematically, with Buy / Sell signals, TP / SL, and a full set of analysis tools all in one.
 Scan the QR Code to add our LINE OA and ask any questions right away

Developed by Many Indicator Co., Ltd. — a developer of indicators for chart analysis and trading, operating as a legally registered company.
MTI is an indicator for chart analysis and trade decisions on TradingView, developed to help you see market direction more clearly and focus on trading in line with the price trend (Trend Following)
The core idea is to help you avoid guessing the market or forcing counter-trend entries — instead, focus on moments when the market has a clear trend and trade with the market's momentum systematically.
This indicator does not open orders for you automatically. You remain the main decision-maker for entering and exiting orders. MTI acts as an analysis aid that makes reading charts easier and more systematic, and helps filter entry timing so it aligns with the market trend.
The components used to enter trades by signal and with the market trend
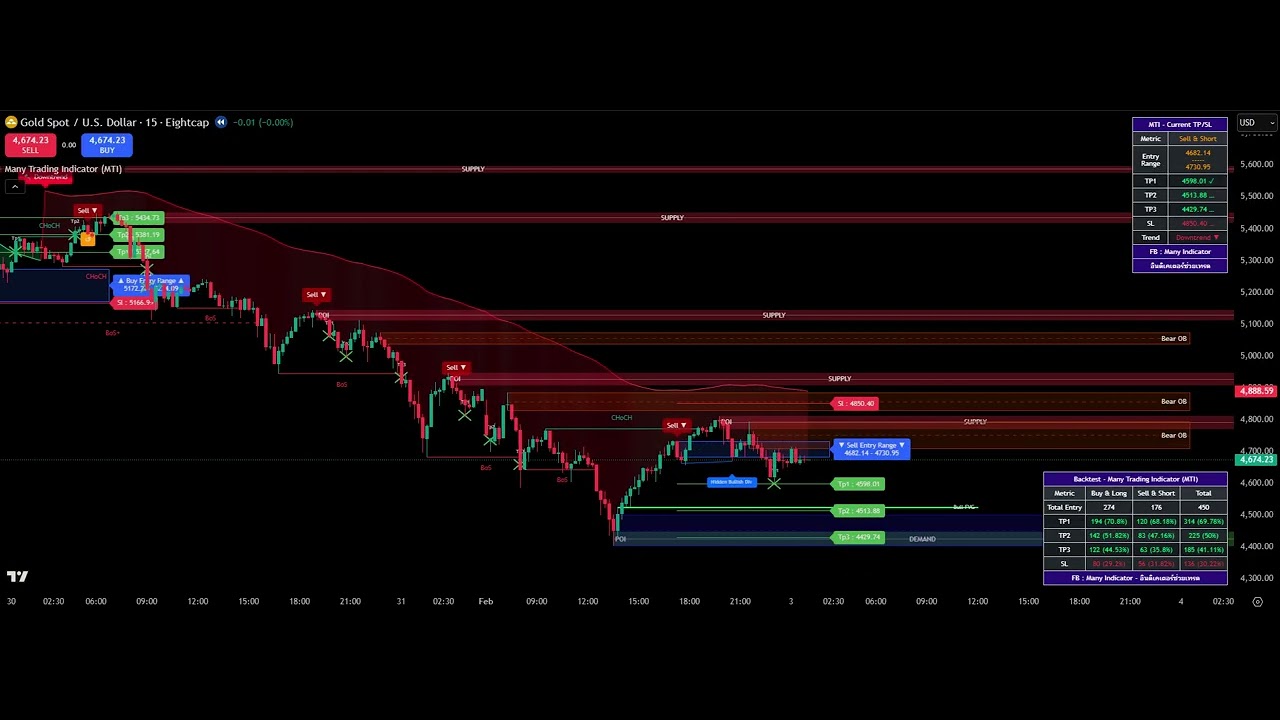
MTI's strength is its focus on trading with the market's main trend. The system shades coloured bands on the chart to show market conditions clearly — green zones are Uptrend and red zones are Downtrend — so you can read market direction at a glance.

A core function that displays entry signals, focused on trading with the trend. It does not create counter-trend signals, making entries easier to spot.

The system shows the key levels of each signal — Entry, Entry Range, TP, and SL — to guide order entry, set profit targets, and limit risk before you even enter the trade.

A table summarising the latest signal's key data in an easy-to-read format — the signal side, Entry Range, TP1-3, SL, and the market's main trend.

Calculated through a custom Moving Average built by our team, it shows whether the market is in an Uptrend or Downtrend and filters the direction of Buy-Sell signals.

Supplementary functions that help you understand the system's context during real use

Displays a marker when a signal reaches the Take Profit or Stop Loss the system set, making it easy to review past results.

A yellow arrow marks when a signal flips sides within the system while the original order has not yet reached SL, helping you adapt quickly to the latest trend.

Shown when the system has no clear entry signal yet, reducing rushed entries when the market doesn't meet the conditions.
For those who want to read charts and plan entries on their own in more detail

Displays market structure — BoS / CHoCH (with sub-wave + levels) — to show whether the trend is continuing or starting to change.

Shows Bullish (blue) and Bearish (orange) zones at price areas with prominent past buying or selling, to watch how price reacts.

Shows zones where price previously had clear buying or selling, to help assess areas where price may react.

Displays price gaps caused by unusually fast moves, to help assess pullbacks or re-entries in the original direction.

Automatically detects 4 forms of RSI Divergence (Regular / Hidden), confirmed over 5 candles before being displayed.
All the extra tools are designed around Price Action and the Smart Money Concept, helping you read the market more deeply within one system.
The Backtest table gives an overview of roughly what proportion of MTI's past signals reached each target level (example from the system's overall total).
The Backtest table is only the system's historical data and does not guarantee future results. Actual results still depend on market conditions, timeframe, asset, and each user's risk management.

MTI works with Forex, Crypto, Gold, and stocks, with a recommended timeframe for each market.
| Market | Recommended timeframe | Signal frequency (approx.) |
|---|---|---|
| Forex | 1 / 5 / 15 min | 1 min ~20-40 signals/day |
| Crypto | 15 / 60 min | 5 min ~5-10 signals/day |
| Stocks | 15 / 60 min | 15 min ~1-3 signals/day |
| Overall recommendationBest | 15 min | a balance between signal quality and market stability |
Configure it to your trading style — no need to watch the screen all the time

Adjust Trend Sensitivity (High / Normal / Low) and the TP/SL Factor (ATR-based) to suit your trading style — to start, we recommend the tested default values.

Set the system to alert you immediately when a signal occurs, so you don't have to watch the screen all the time.
No monthly fees — start using it right after payment
After payment, contact us on our Facebook page to receive indicator installation service right away.
Pay once, use forever — your MTI access stays the same regardless of any future changes to the service or pricing.
After payment, our team helps with installation — see the example steps in the images below.
MTI is an Invite-only indicator. After payment, simply send your TradingView Username to our team to receive access — see how to find your own Username in the example image.

Open TradingView on desktop → click the Indicators menu → choose Invite-only → click Many Trading Indicator (MTI) to enable it on your chart.

In the TradingView mobile app → tap the ••• menu → choose Indicators → choose Invite-only → tap the indicator name to enable it.

MTI comes with a full 49-page user manual that explains everything — the development concept, how to use it, the core functions, the extra functions, and all the settings within the system. It helps you understand the indicator more easily and apply it appropriately to your own trading style, from the basics through to in-depth detail.
The manual is created so MTI users can study from the basics to advanced detail and use every function systematically.
Open the Full User ManualWith the core functions plus the full set of extra functions enabled, you can see the indicator working more completely — entry timing, trend-tracking points, and the supplementary components that make chart analysis more detailed, all on one screen.
📍 MTI is designed to work both for watching the main signals and for using the extra functions to help filter timing, read price structure, and make decisions more systematically. It suits anyone who wants a tool that offers more than just entry-exit signals, with a fuller set of analysis components to back it up.
In this Replay mode you'll see the system working continuously — both the indicator's core functions and the various extra functions enabled together — simulating real use on the chart and how the system displays through each phase of the market.
No. MTI is an analysis aid; it does not open orders for you automatically. You remain the one who decides when to enter and exit orders.
No repaint. Signals shown on the chart appear strictly according to the system's real conditions. Once a signal appears, you can use it as a reference to enter immediately, without waiting for the candle to close.
It works with any asset and any timeframe — Forex, Crypto, Gold, and stocks. Overall we recommend the 15-minute timeframe, as it balances signal quality with market stability.
It does not guarantee profit. MTI is an analysis aid, and the Backtest statistics are only historical data that do not guarantee future results. Trading carries risk and should always be used together with risk management.
After your payment is complete, simply send your TradingView Username to our team to receive access, then enable the indicator from the Invite-only menu on TradingView (see the steps in the "How to Use" section and the full user manual).
Yes. Beginners can start with the main signals (Buy-Sell and TP/SL) first, then gradually learn the extra functions in sequence as they become more familiar with the system.
Start using the Many Trading Indicator today, with a full manual and a team to support you throughout.
Buy the Indicator — 3,490 THB ManyTrader